Analytics
Consent Analytics is a real-time dashboard that gives privacy, compliance, and marketing teams visibility into how users are interacting with your consent banner.
The dashboard is organized into two tabs:
- Overview: Banner performance, consent rates, audience addressibility, and channel/device breakdowns
- Compliance: Jurisdictional consent rates, privacy signals (GPC/DNT), cookie inventory, and policy revision history
To access this feature, select the Analytics tab (labeled Beta) within Consent Management.
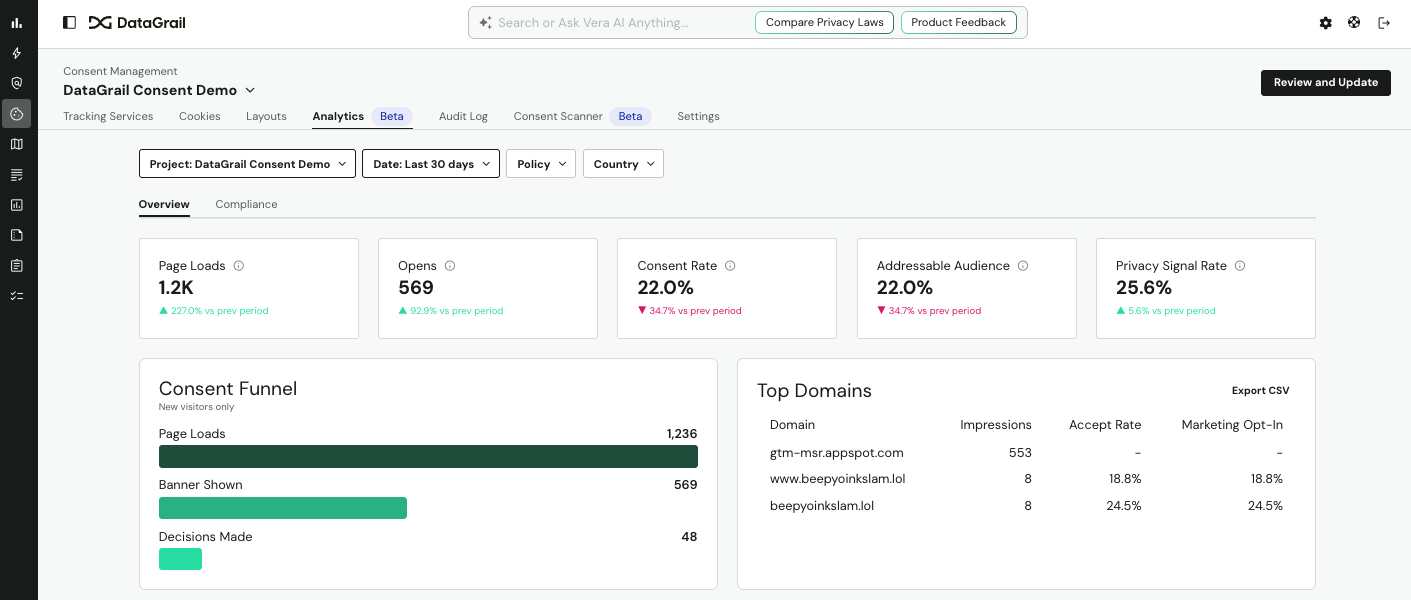
Overview Tab
The Overview tab is designed for marketers and product owners who want to understand banner reach, consent rates, and addressable audience size.
Topline KPI Cards
Five metric cards display at the top of the page, each with a trend indicator showing change vs. the previous period.
| Metric | What It Measures |
|---|---|
| Page Loads | Total page load events recorded during the period |
| Opens | Number of times the consent banner was shown to a visitor |
| Consent Rate | Percentage of banner interactions that resulted in acceptance |
| Addressable Audience | Percentage of users who have consented to marketing cookies |
| Privacy Signal Rate | Percentage of visitors sending a GPC or DNT signal |
Consent Funnel
A horizontal funnel chart showing the drop-off from page loads → banner shown → decisions made. Scoped to new visitors only.
- Page Loads: All page load events
- Banner Shown: Subset where the consent banner was rendered
- Decisions Made: Subset where the user made an explicit accept/deny choice
Top Domains
A sortable table showing the top domains generating consent impressions. Includes:
- Impressions: Banner view count per domain
- Accept Rate: Percentage of decisions that were accepts
- Marketing Opt-In: Percentage of users who consented to marketing cookies
Select Export CSV in the top-right of the panel to download the full domain list.
Additional Overview Charts
| Panel | Chart Type | What It Shows |
|---|---|---|
| Banner Views by Geography | Choropleth map | World and US-level heat map of banner impressions by country and state |
| Consent Breakdown | Stacked bar | Daily/weekly split of Accept All, Essential Only, Custom, Deny All, and GPC/DNT decisions |
| Consent Trend | Line chart | Weekly accept rate, marketing opt-in rate, and performance opt-in rate over time |
| Device Breakdown | Donut + grouped bar | Impression share and consent rates segmented by mobile, desktop, and tablet |
| Banner Interaction | Area chart | Banner opens vs. decisions made over time; shows interaction rate as an overlay |
| Consent by Locale | Horizontal stacked bar | Consent decision distribution by browser locale/language |
| Banner Visibility Impact | Grouped bar | Consent rate comparison for users who saw the banner vs. those who didn't |
Compliance Tab
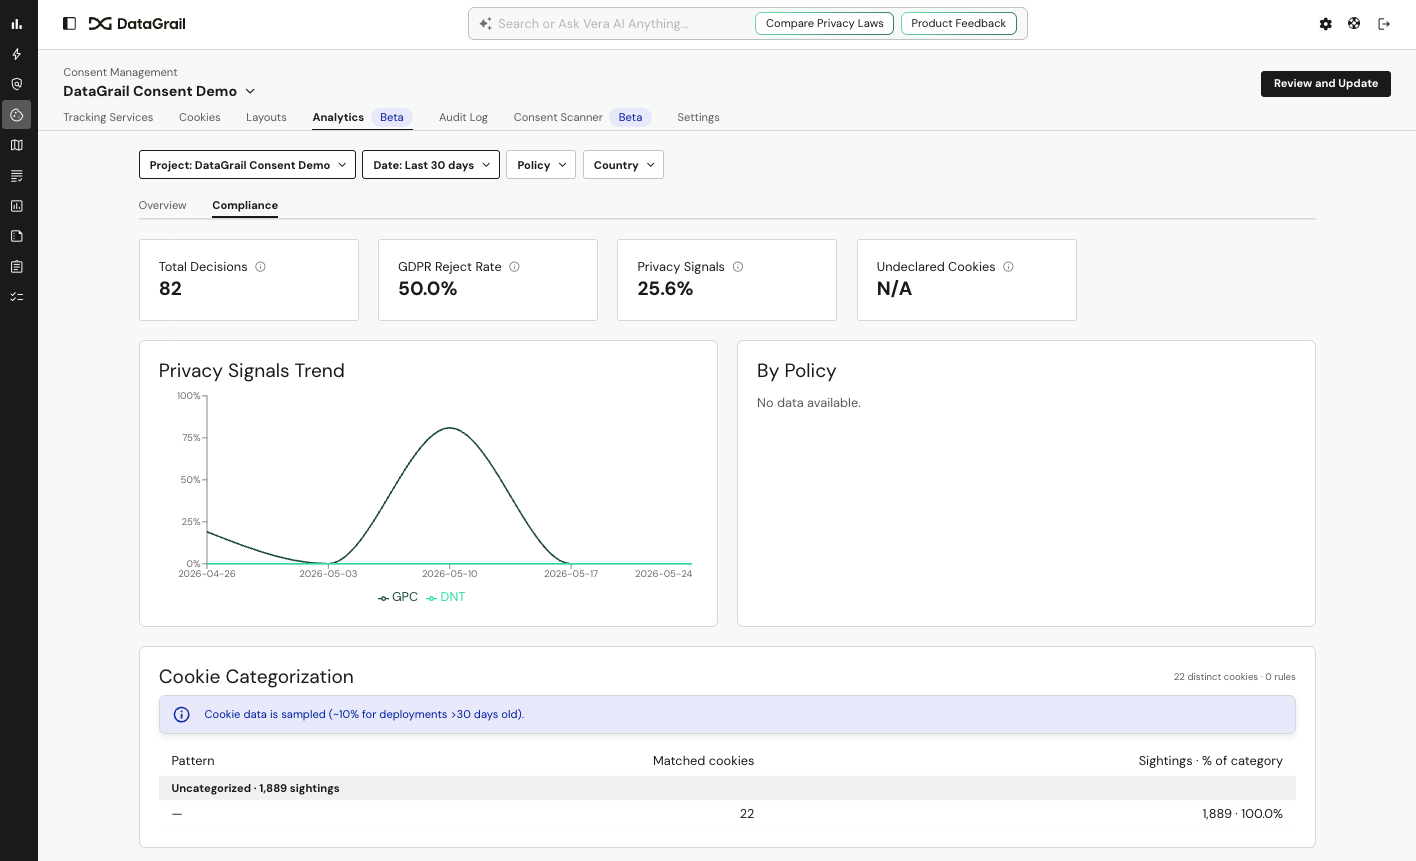
The Compliance tab is designed for privacy officers and legal/compliance teams who need jurisdictional reporting, cookie auditing, and policy change tracking.
Topline KPI Cards
Five metric cards display at the top of the page, each with a trend indicator showing change vs. the previous period.
| Metric | What It Measures |
|---|---|
| Total Decisions | Total explicit consent decisions in the period |
| GDPR Region Reject Rate | Percentage of decisions that were rejections in GDPR-regulated countries |
| GPC/DNT Signal Rate | Percentage of visitors sending a Global Privacy Control or Do Not Track signal |
| Undeclared Cookies | Count of cookies observed on your domains that are not declared in your cookie inventory |
Compliance Charts
| Panel | Chart Type | What It Shows |
|---|---|---|
| Consent by Jurisdiction | Horizontal stacked bar | Accept/reject breakdown by country |
| Privacy Signals Trend | Line chart | GPC and DNT signal volume over time |
Regional Compliance Detail
Full breakdown of consent rates by country and region, including accept rate, reject rate, essential-only rate, and marketing opt-in rate.
Cookie Inventory
All cookies observed on your domains, including:
- Cookie name and category
- Number of sightings
- Domains where observed
- First and last seen dates
For cookies that aren't yet assigned a category, see the Unmanaged tab in Cookie Management.
Cookies Without Consent
Cookies that were observed in sessions where the user denied marketing consent. Rows where the occurrence rate exceeds 50% are highlighted in red as a compliance alert.
Policy Revision History
Consent rates broken down by each version of your consent policy, allowing you to assess the impact of policy copy or layout changes on acceptance rates.
CSV export is available on all data tables. Select Export CSV in the top-right corner of any table panel. Downloaded files are named with the export type and date (e.g., cookie-inventory-2026-05-26.csv).
Frequently Asked Questions
Below are answers to common questions about Consent Analytics data and behavior.
How fresh is the data?
Consent Analytics is powered by a real-time pipeline. Data ingested via banner interactions (page loads, opens, decisions) is available in the dashboard within seconds of the event occurring. Historical data may reflect a backfill period for older events.
Why does my Consent Rate differ from my Addressable Audience percentage?
Consent Rate reflects the share of banner interactions that resulted in acceptance. Addressable Audience reflects the share of all visitors (including those who never saw the banner) who have an active marketing consent. These will differ if a significant portion of your visitors are returning users with stored preferences.
What does "Banner Visibility Impact" show?
This panel segments users into those who were shown the consent banner versus those who were not (e.g., returning visitors with stored consent), and compares the accept/reject/marketing consent rates between the two groups.
Why do some domains show a dash (–) for Accept Rate?
A dash indicates the domain had impressions but no explicit decisions were recorded during the period. This can happen for domains where all visitors are returning users with stored preferences.
How far back can I query?
Date range queries are supported up to the full extent of your historical data. Dashboard queries for 30-day windows load in under 2 seconds. Larger date ranges may take longer.
What is a GPC/DNT signal?
Global Privacy Control (GPC) and Do Not Track (DNT) are browser-level privacy signals that indicate a user's preference not to be tracked or have their data sold. DataGrail detects and honors these signals automatically and surfaces their volume in the Privacy Signal Rate metric.
Disclaimer: The information contained in this message does not constitute as legal advice. We would advise seeking professional counsel before acting on or interpreting any material.