Integration Errors
Integration Errors helps you quickly identify and resolve issues with your connected integrations. Instead of investigating individual failed requests one at a time, you can now see all integration errors in one centralized dashboard, making it easier to spot patterns and prioritize fixes.
The dashboard shows errors from the last 30 days, grouped by integration and error type, so you can quickly understand which connections need attention.
Need help understanding an error? Ask Vera to analyze your integration errors and get AI-powered troubleshooting guidance directly in chat. Learn more about Vera's capabilities.
An unresolved integration error will block your operations across DataGrail products. By monitoring and resolving integration errors proactively, you ensure operations complete successfully and on time.
Viewing Integration Errors
Super Admin, Request Agent, Live Data Map Admin, and Connections Manager roles can view the Integration Errors page.
- Select Integrations in the main navigation
- Navigate to the the Errors tab
- View your error dashboard with filtering and search
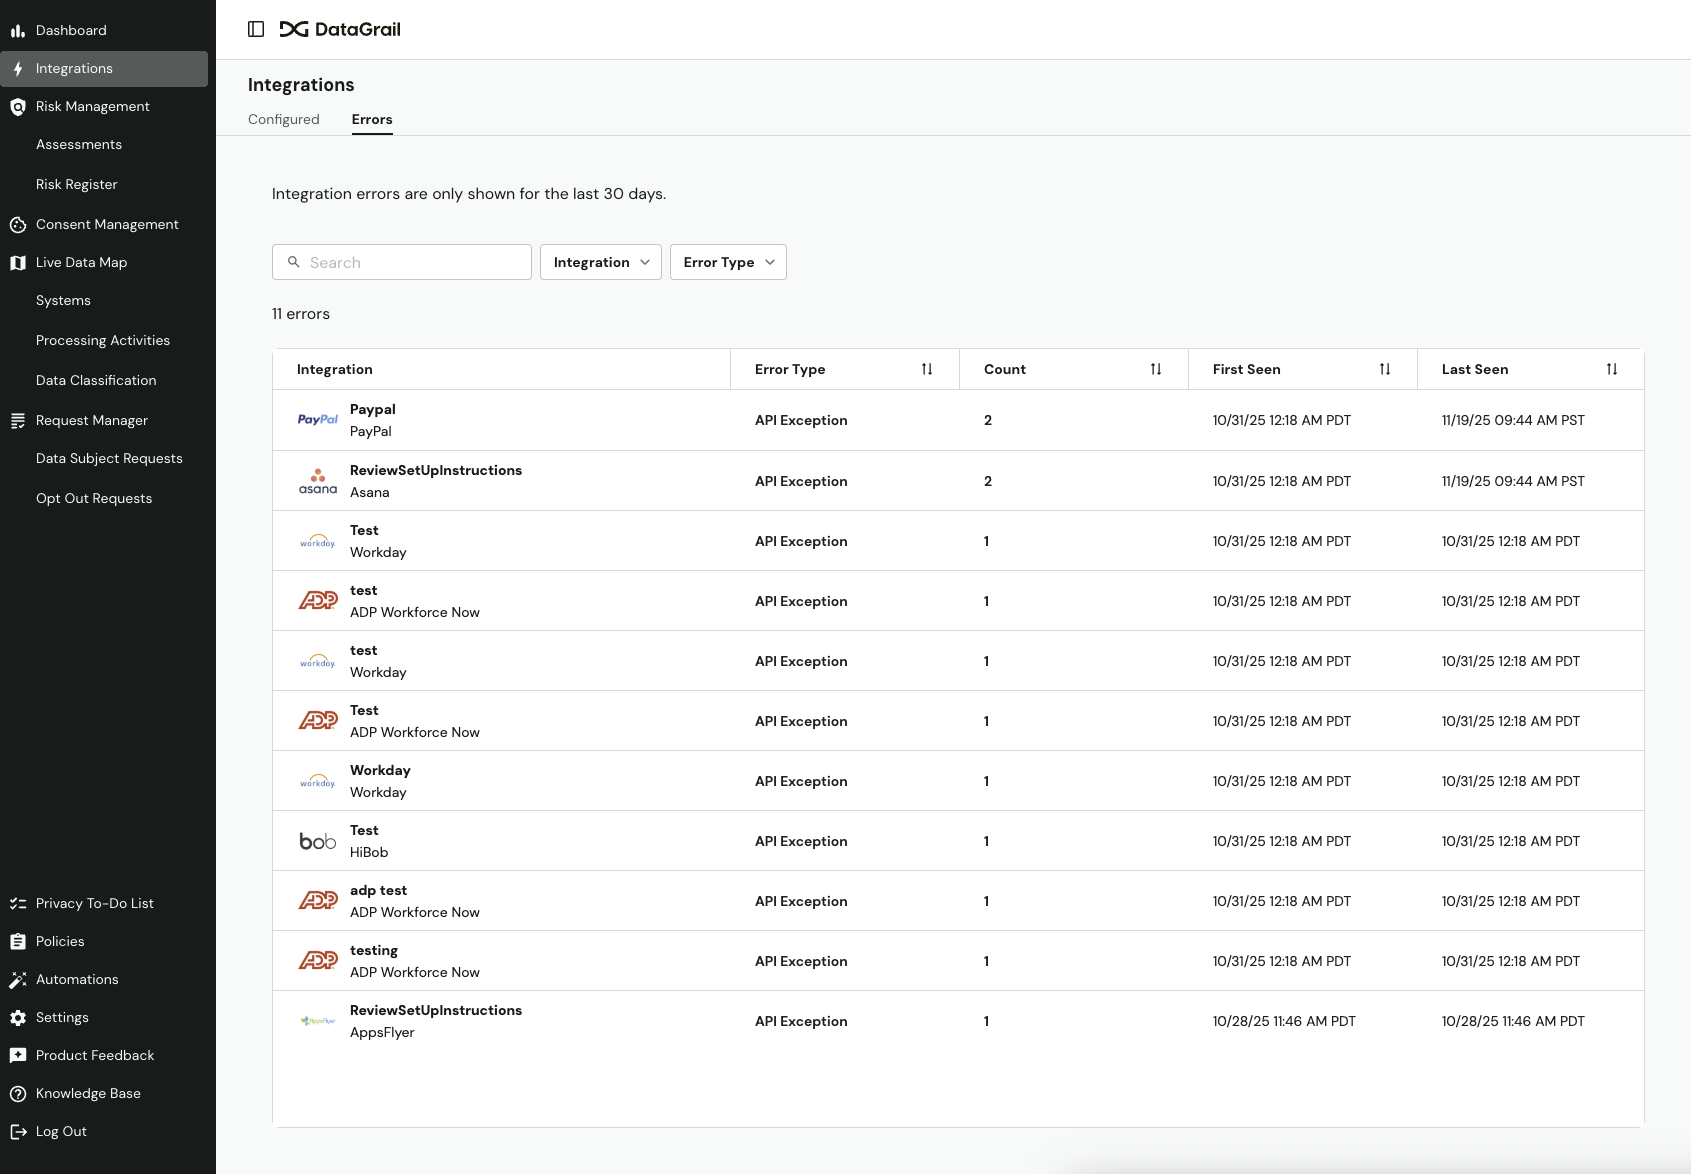
Understanding The Error Dashboard
The error dashboard displays a table with the following information. Use the filters and search bar to isolate errors for specific connections or error types.
| Column | Description |
|---|---|
| Integration | The name of the integration with the error. |
| Error Type | The category of error (e.g., API Unauthorized, API Rate Limit). See Error Types and Remediation for what each error means and how to fix it. |
| Count | How many times this error occurred in the last 30 days. High counts indicate recurring issues that should be addressed promptly. |
| First Seen | When this error first appeared within the 30-day window. |
| Last Seen | The most recent occurrence of this error. |
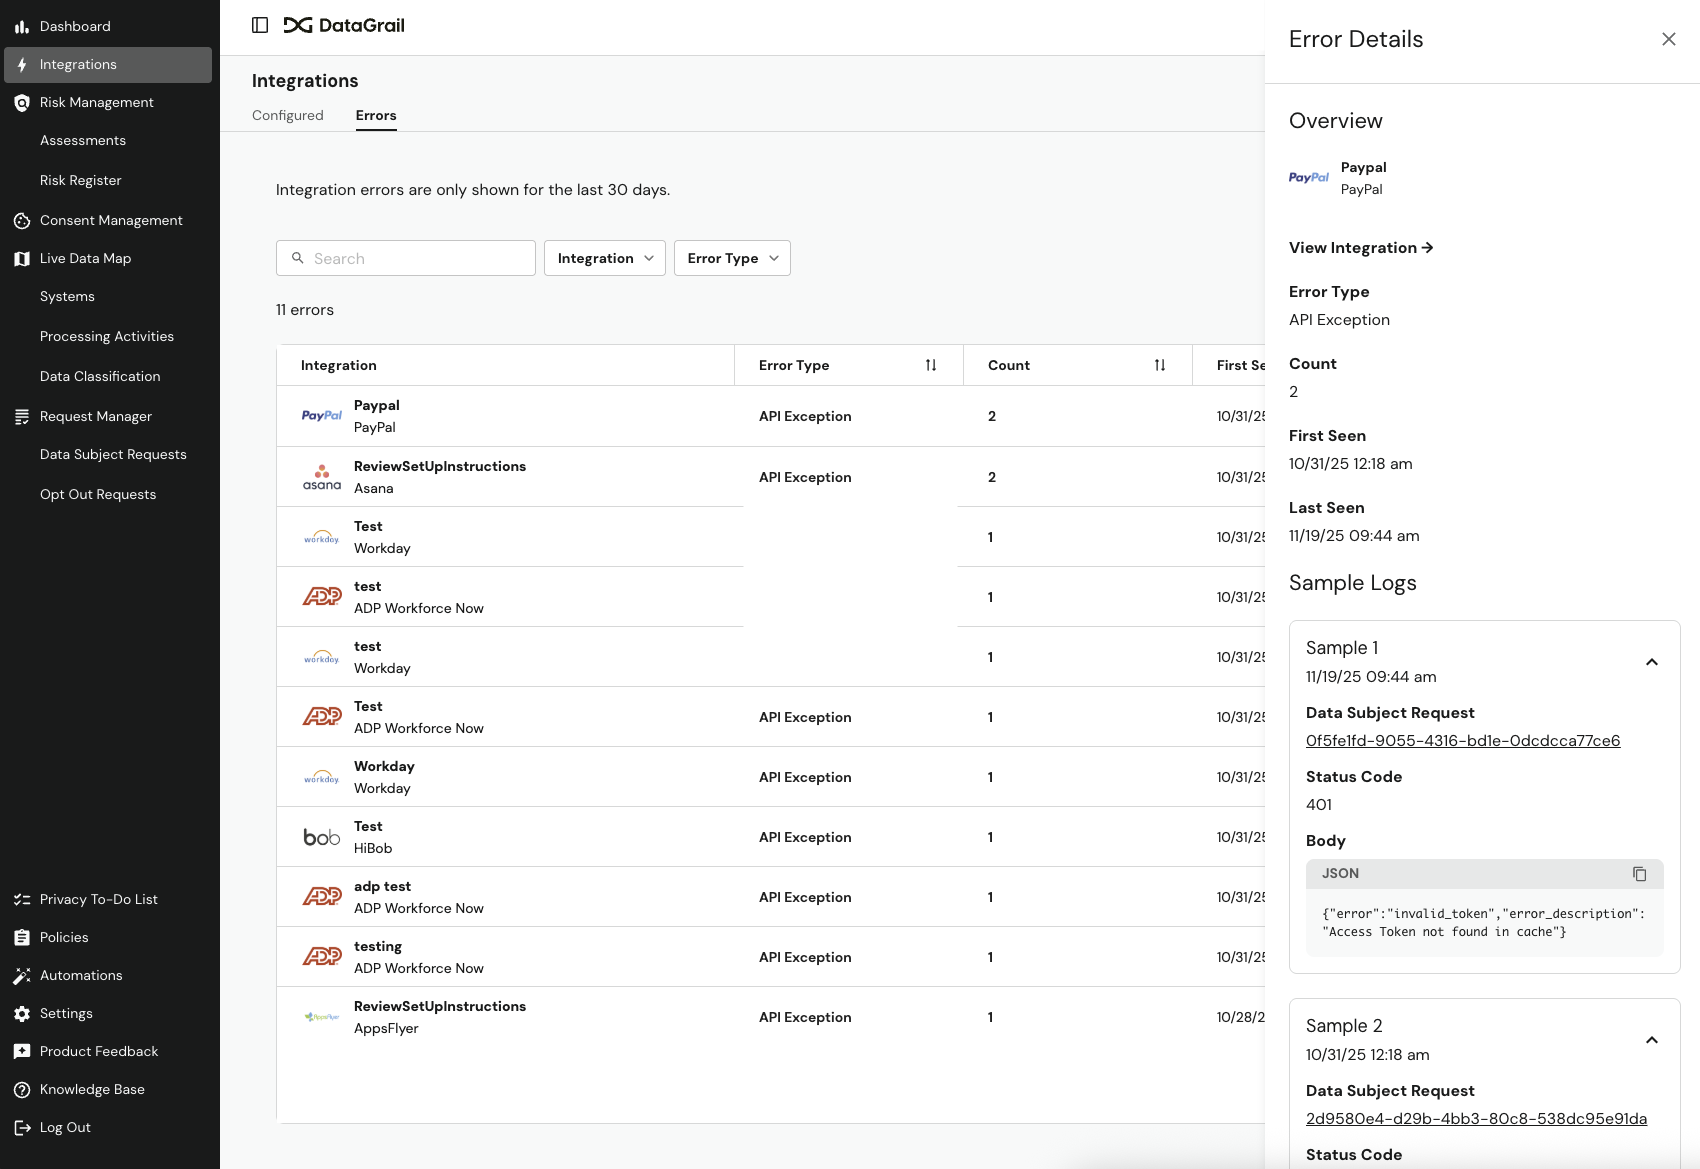
Investigating Error Details
Select any row in the table to open a detailed panel with the Error Summary and up to 3 Sample Logs.
The panel displays an Error Summary with the integration name (linked to full settings), error type and description, total count, and first/last occurrence dates.
Below that you'll see up to 3 Sample Logs with timestamps, status codes, error messages, links to affected operations (such as Data Subject Requests in Request Manager, if available), and the complete JSON response from the API.
Use the error details to diagnose and resolve issues:
- Check the error message and status code to identify the problem, and review Error Types and Remediation for more information on each status code.
- Review multiple sample logs to identify patterns.
- Select linked operations (such as Data Subject Requests in Request Manager) to see impacted requests.
- Copy the JSON response to share with support or the vendor, if needed.
Error Types and Remediation
The most common issue you may encounter when using integrations is an integration error. The table below outlines the types of integration errors, what they mean, and what you can do to resolve them.
DataGrail retries all unfinished integrations daily. If an integration encounters an error, it may be resolved when it is rerun the next day. In Request Manager, you can also manually retry integrations on a privacy request.
| Error Type | Error Codes | Description | Remediation Steps |
|---|---|---|---|
| Disconnected Integration | - | This integration is disconnected from DataGrail. This often occurs when a credential has expired. | Generate new credentials in the third-party system and Reconnect the Integration to DataGrail. |
| Authorization Error | 401 | The original System Admin credentials provided to DataGrail are now invalid (e.g., admin left the company, was promoted, etc.) | 1. Identify a new admin for the disconnected system. 2. Grant the new admin access to DataGrail. 3. Have the new admin generate new credentials in the third-party system and Reconnect the Integration to DataGrail. |
| Insufficient Permissions | 403 | Unable to process request because DataGrail does not have required permissions to take action (e.g., a deletion action can't be completed with read-only permissions) | 1. Locate the integration in DataGrail. 2. Select View Connection Instructions. 3. Review the required permissions and scopes and ensure they are granted in the third-party system. |
| Rate Limit Error | 429 | DataGrail has exceeded the API call limit (within the last 48 hours) for the third-party system. | No action required. DataGrail will retry indefinitely and the request should process once the rate limit allows. Alternatively, contact a system admin or the third party directly to increase your API limits. |
| Internal Server Error | 5xx | Integration API server is not ready to handle the request. It can be a temporary error that may be resolved automatically. | Wait 24 hours as 5xx errors are often transient and likely to resolve when the integration is retried. If the error persists, reach out to support@datagrail.io. |
| Unprocessable Request | 404 | Integration API server cannot find the requested resource. | Reach out to support@datagrail.io to investigate further. |
| Request Timeout | 408 | Processing has been interrupted due to request timeout. | Wait 24 hours as 408 errors are often transient and likely to resolve when the integration is retried. If the error persists, reach out to support@datagrail.io. |
| Request Error | 400, 422 | Integration API server cannot process the request due to a request error. | Reach out to support@datagrail.io to investigate further. |
| DataGrail Error | - | We're experiencing a problem with this integration. | Reach out to support@datagrail.io to investigate further. |
Best Practices
Follow these best practices to maintain healthy integrations and minimize disruptions to your workflows.
Regular Monitoring
- Check the Integration Errors Dashboard weekly
- Pay attention to Last Seen dates to identify active issues
- Address errors with high counts first
Proactive Maintenance
- Refresh credentials before they expire
- Monitor rate limit errors and request limit increases with vendors, if needed
- Keep integration configurations up to date when vendors make changes
When to Escalate to DataGrail
- Errors persist for more than 48 hours after attempting fixes
- You've refreshed credentials, but still see authorization errors
- Multiple integrations show the same error type simultaneously
Disclaimer: The information contained in this message does not constitute as legal advice. We would advise seeking professional counsel before acting on or interpreting any material.