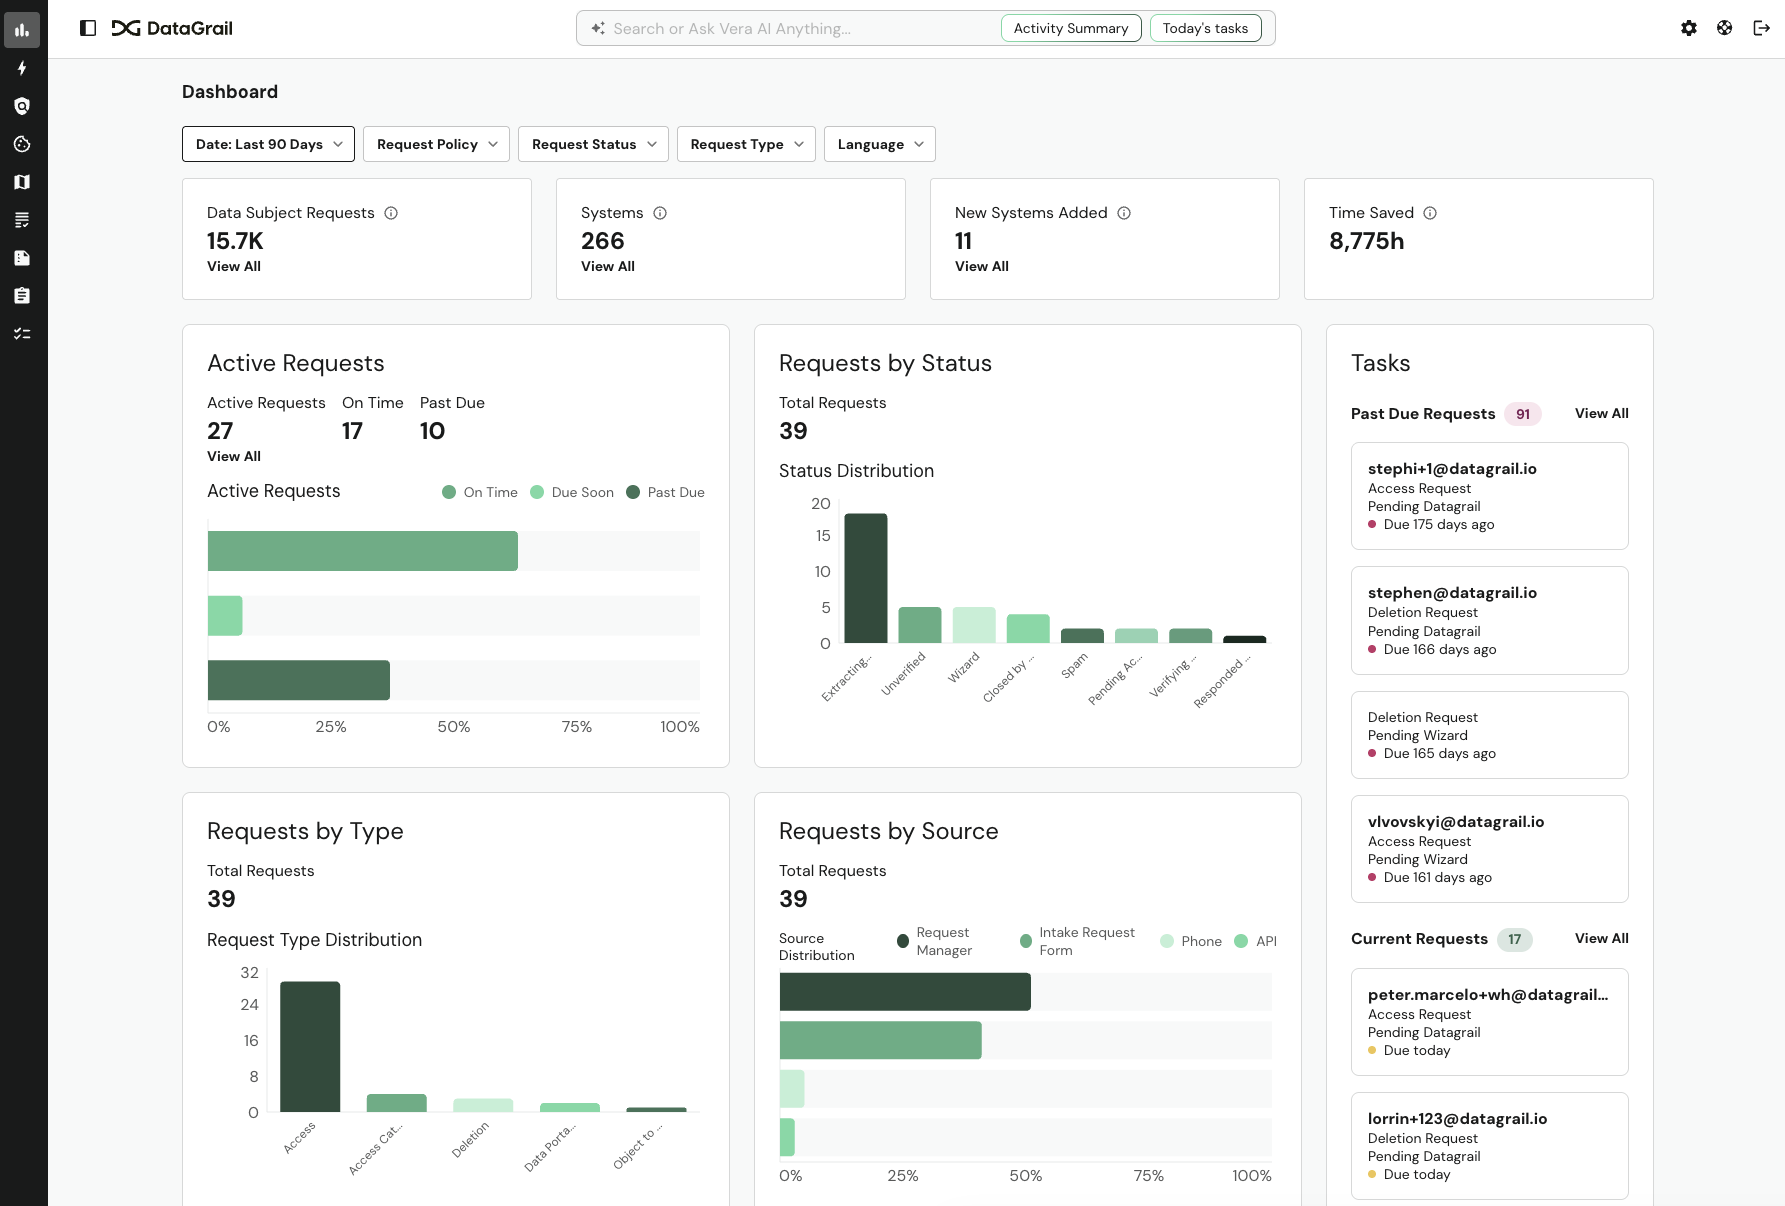
Privacy Dashboard
The Dashboard surfaces key privacy insights and active DataGrail tasks, so you can focus your attention where it's needed most.
The metrics available on your dashboard depend on the products in your DataGrail account.
Filters
You can filter dashboard metrics using the filter bar at the top of the page. Available filters include:
| Filter | Description |
|---|---|
| Date | Filter metrics by date range (e.g., Last 90 Days) |
| Request Policy | Filter by specific privacy request policy |
| Request Status | Filter by request status |
| Request Type | Filter by request type (Access, Deletion, etc.) |
| Language | Filter by request language |
Some filters are not relevant to certain metrics and may have different meanings across tiles. The behavior of each dashboard tile is documented below.
Summary Metrics
The top row displays high-level metrics that provide quick insight into Request Manager and Live Data Map. Select View All on any tile to see more details.
| Metric | Description |
|---|---|
| Data Subject Requests | Total number of data subject requests received |
| Systems | Total number of systems detected and/or added to your inventory |
| New Systems Added | Number of systems added to your inventory over the last 30 days |
| Time Saved | Time saved based on the average time to manually complete a request multiplied by the number of requests received |
Active Requests
Active Requests provides a snapshot of your current request volume and their status against deadlines. These metrics do not include Opt Out Requests.
The bar chart shows the distribution of requests by status: On Time (green), Due Soon (yellow), and Past Due (red). If using a date filter, requests are filtered based on the day they were created. Select View All to open the Data Subject Requests page.
| Metric | Description |
|---|---|
| Active Requests | Count of all privacy requests in an active state |
| On Time | Count of active requests with more than 5 full calendar days remaining until their due date |
| Past Due | Count of active requests where the current date is after the request due date |
Requests by Status
Requests by Status shows the distribution of requests across different workflow statuses. This helps you understand where requests are in the processing pipeline.
The bar chart displays the count of requests in each status, such as Extracting Data, Unverified, Wizard, Closed, Spam, Pending Action, Verifying, and Responded.
Requests by Type
Requests by Type breaks down your request volume by request type. This helps you understand which types of requests you receive most frequently.
The bar chart shows the distribution across request types such as Access, Access Categories, Deletion, Data Portability, and Object To Processing.
Requests by Source
Requests by Source shows where your requests originate from. This helps you understand how data subjects are submitting their requests.
The horizontal bar chart displays the percentage distribution across sources:
| Source | Description |
|---|---|
| Request Manager | Requests created manually in Request Manager |
| Intake Request Form | Requests submitted through your intake form |
| Requests submitted via email | |
| Phone | Requests received via phone |
| API | Requests submitted through the API |
Requests by Language
Requests by Language displays the language distribution of your requests. This helps you understand the language preferences of your data subjects.
The horizontal bar chart shows the percentage of requests by language code (e.g., "en" for English).
Request Velocity
Request Velocity provides insight into how your team is processing privacy requests against their deadlines over time. This helps you track how your privacy program is pacing.
If using a date filter, requests are filtered based on the day they were created. Unverified and manually denied requests are not included in these metrics.
Requests Closed
| Metric | Description |
|---|---|
| Avg. Days to Close | Average time between Pending Wizard and Closed |
| On Time Closed | Count of requests closed before their due date |
| Past Due Closed | Count of requests closed after their due date |
Verification to Close Velocity
The line chart shows the average number of days to close a request over time. The time begins when the requestor is verified and ends when the ticket is complete.
Direct Contact Integrations
Direct Contact Integrations shows your connected Direct Contact Integrations and how quickly processors complete requests. This helps you identify opportunities to improve workflow efficiency with vendors or internal processors.
If using a date filter, metrics only consider integrations that processed requests in the selected date range. Unverified and manually denied requests are not included in these metrics. Select View All to see all integrations.
Integration Performance
| Metric | Description |
|---|---|
| Total Integrations | Count of Direct Contact Integrations |
| Avg. Time to Close | Average time to complete a Direct Contact Form across your processors (in minutes) |
Longest Avg. Processing Time
The bar chart shows processing time by integration, helping you identify your slowest processors.
Consent Banner Selections
Consent Banner Selections provides insight into how users interact with your Consent Banner, helping you understand how users exercise their privacy preferences.
If using a date filter, metrics are filtered based on when each action was recorded.
| Metric | Description |
|---|---|
| Views | Count of times your consent banner has been shown |
| Accept All | Count of times users selected Accept All |
| Essential Only | Count of times users denied all tracking services |
| Custom | Count of times users modified preferences at the category level |
| DNT | Count of times a user visited with a Do Not Track (DNT) signal |
| GPC | Count of times a user visited with a Global Privacy Control (GPC) signal |
| Exit (X) | Count of times a user exited the banner with the X button |
The stacked bar chart visualizes the distribution of these selections.
Opt Out Requests
Opt Out Requests provides an overview of how you are processing Opt Out Requests against their deadlines.
The bar chart shows the distribution of requests by status: On Time (green), Due Soon (yellow), and Past Due (red). If using a date filter, requests are filtered based on the day they were created. Select View All to see all opt out requests.
| Metric | Description |
|---|---|
| Active Requests | Count of all opt out requests in an active state |
| On Time | Count of active opt out requests with more than 5 full calendar days remaining until their due date |
| Past Due | Count of active opt out requests where the current date is after the request due date |
Tasks
Tasks displays your highest priority requests that need action, organized by urgency. Tasks visible to you depend on your assigned User Role.
Each task shows the requestor email, request type, current status, and due date. Different colored indicators show the urgency:
- Red indicates past due requests
- Green indicates requests due soon or on time
Select View All to open the Data Subject Requests page with the relevant filter applied.
| Section | Description |
|---|---|
| Past Due Requests | List of active privacy requests that are past their due date |
| Current Requests | List of active privacy requests that are on time |
Disclaimer: The information contained in this message does not constitute as legal advice. We would advise seeking professional counsel before acting on or interpreting any material.