Testing & Validation
Before moving into production, use Test Mode to validate your Data Broker Compliance setup using the DROP Platform sandbox environment and synthetic data provided by CalPrivacy. Test Mode allows you to validate your DROP configuration, run the matching pipeline, review processing behavior, and optionally test your internal system integrations before using production DROP data.
Before configuring Test Mode in DataGrail, confirm you have access to the DROP Platform sandbox environment:
- Log in to your CCPA DROP data broker account
- Confirm your data broker profile registration is complete
- Navigate to the Sandbox Environment page and select the consumer deletion list subscription(s) that apply to your organization
Once these steps are complete, you should have your DROP sandbox API key and a synthetic dataset for testing. You'll need both to configure Test Mode below.
Create a Test Broker Registration
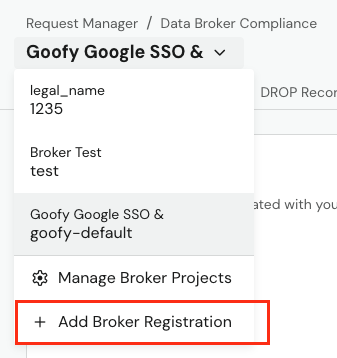
In the Data Broker Compliance module in DataGrail, select your company name, then select + Broker Registration.
- In the Create Broker Registration drawer, enter your Broker ID, Legal Name, and Integration Kind.
- Select Test mode only. This is required to enable the testing environment for this broker registration.
- Select Create.
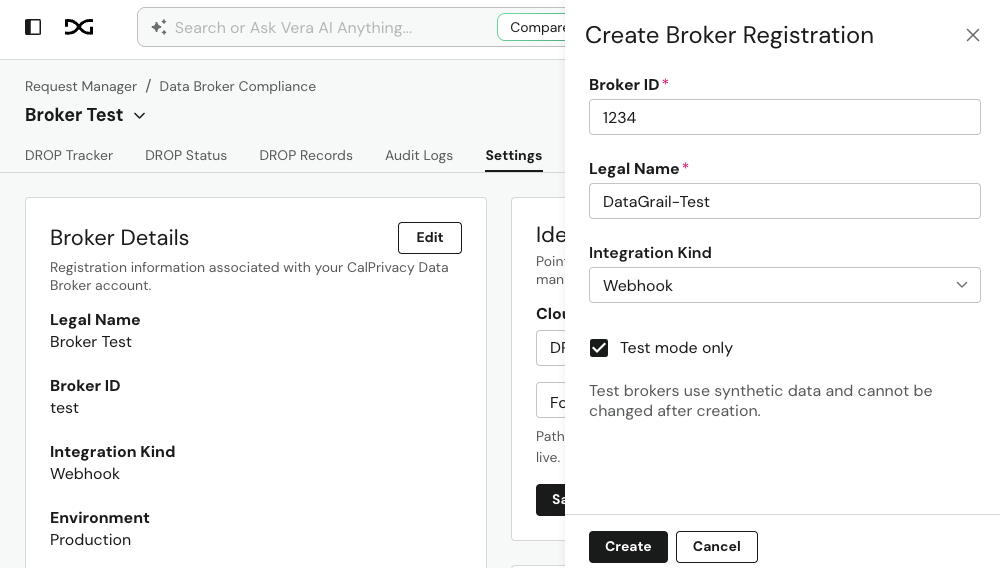
Once the test broker registration is created, you'll see a new Test Mode tab alongside Settings.
The same Broker ID cannot be used across multiple broker registrations in DataGrail. If your Broker ID is already associated with your primary broker registration, temporarily remove it from that registration while completing testing.
Connect Your DROP Sandbox Credentials
To process data in Test Mode, connect the broker registration to the DROP Platform sandbox.
- From the test broker registration you just created, go to Settings.
- Under DROP Credentials, select Connect.
- Enter your DROP sandbox API key. Your Broker ID will already be populated based on the Broker ID entered when you created the registration.
- Select Use Sandbox Environment.
- Select Connect.
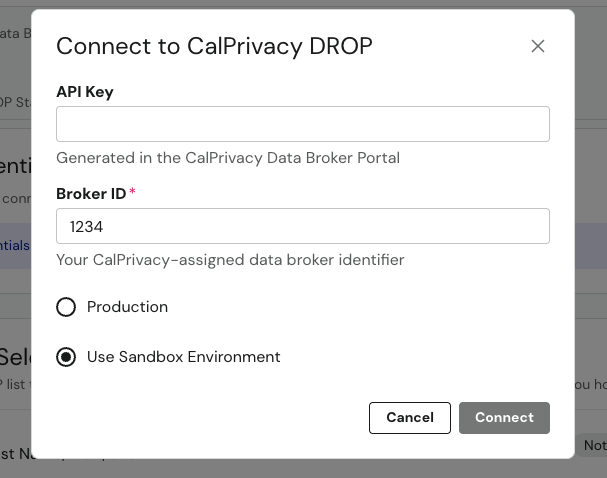
Your test broker registration is now connected to the DROP sandbox environment.
CalPrivacy rotates the DROP sandbox API key daily. If you update the key in DataGrail on one day, you'll need to update it again the next day with the new key. This only applies to the sandbox environment — your production DROP API key does not rotate.
Configure Your DROP List Selections
Select the DROP lists that apply to your organization.
- From the test broker registration, go to Settings.
- Under DROP List Selections, toggle each applicable identifier ON.
- Your selection automatically saves and displays as Subscribed.
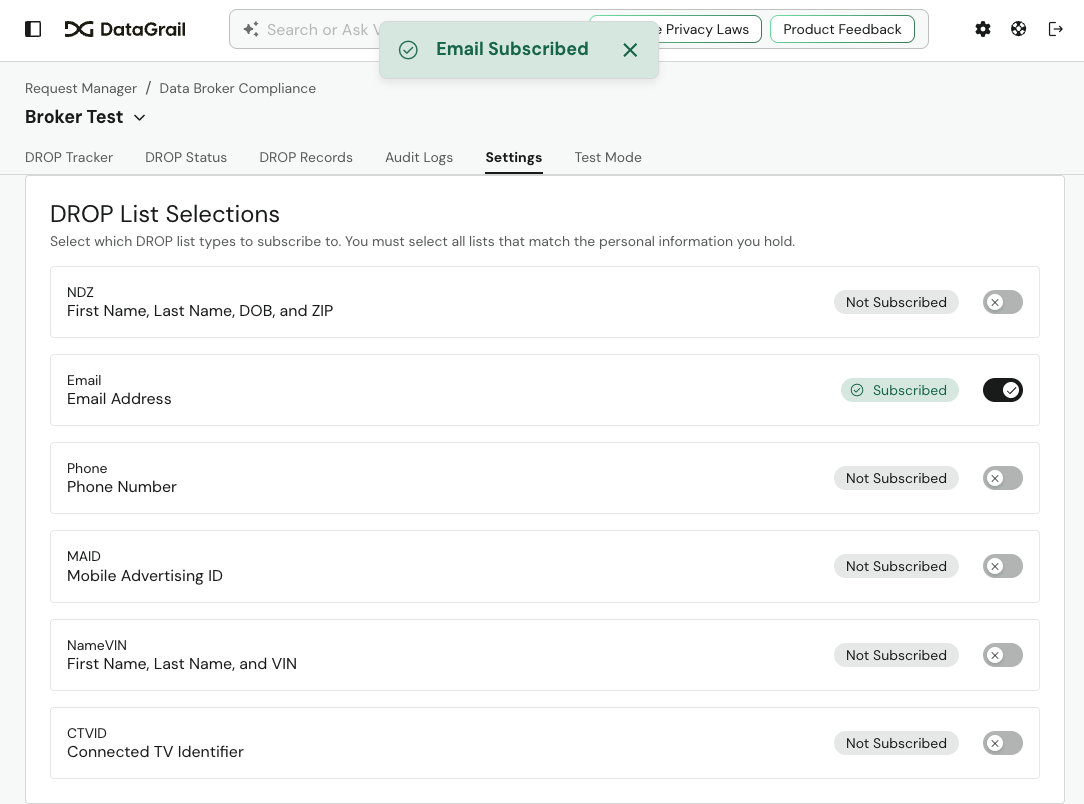
Your DROP List Selections tell DataGrail which hashed identifier types to retrieve from DROP and compare against the hashed identifiers provided through your ingestion source.
Connect Your Cloud Storage Bucket
You'll need a cloud storage location containing the synthetic data you want to use for hash-matching tests.
- From the test broker registration, go to Settings.
- Under Identifier Ingest Source, select Connect New Cloud Storage Bucket.
- Select the cloud storage system you'll use. You'll be redirected to that system's integration page — enter the appropriate credentials.
- Select Configure Integration. Once complete, you'll be redirected to the Data Broker Compliance Settings page.
- From the Cloud Storage Integration dropdown, select the bucket you configured.
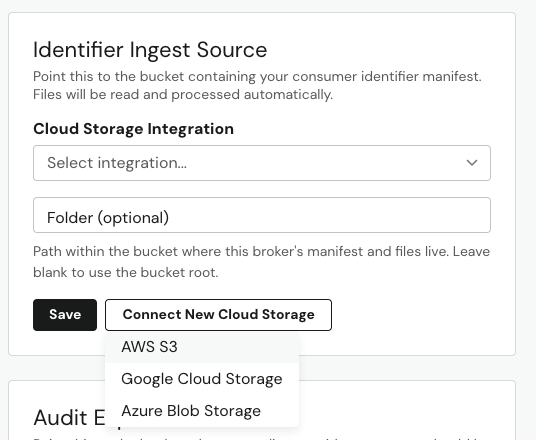
You can use a cloud storage bucket that's already connected for DROP. If needed, use the Folder (optional) field to specify a dedicated folder within that bucket for DataGrail to pull from during testing.
Aggregate Test Tracker Charts
If you're repeatedly refreshing test data, the DROP Tracker tab's Burndown and Velocity charts normally only reflect your latest download — so they can appear to reset with each new run.
Under DROP Tracker Charts in the Test Mode tab, toggle Aggregate tracker charts across all recent data ON to aggregate these charts across all DROP data from the last 45 days instead. This lets the charts populate immediately without waiting for multiple daily snapshots to accumulate.
End-to-End Test Your Setup
Import your synthetic customer identifiers before you bring in your DROP data, so matching can happen as soon as your DROP data arrives instead of waiting for the next scan.
- Run Import from Ingestion Source — under Run Real Pipeline in the Test Mode tab, select Run Import from Ingestion Source to import your synthetic customer identifiers from your connected cloud storage bucket.
Then get your synthetic DROP data into DataGrail one of two ways:
- Download from DROP — under Run Real Pipeline in the Test Mode tab, select Download from DROP to pull your synthetic dataset directly from the DROP sandbox environment via the DROP sandbox API.
- Upload a CDL file manually — download the synthetic Consumer Deletion List (CDL) files from the DROP sandbox environment yourself, then go to the DROP Status tab and select Upload CSV for each file.
Which path you use is a matter of preference — both produce the same DROP records. If you upload manually, the file must be unedited from what CalPrivacy's sandbox provides, and must follow CalPrivacy's CDL file schema and file naming convention.
To confirm your test setup actually produces matches, make sure at least a few of the same synthetic consumer identifiers exist in both your DROP data and your identifier ingestion source before you pull either one in. See Ingestion Format for exactly how to format and deliver identifiers to your cloud storage bucket.
Matching alone won't resolve a test record to an outcome, though — a matched record stays open until you select Send Real Deletion Requests to dispatch it to your connected internal system integration. See Test Your Internal System Integrations below.
Test Your Internal System Integrations
To complete your end-to-end test, validate that matched DROP requests can be processed through your internal systems. Use Send Real Deletion Requests to dispatch real deletion requests to your connected integration.
Before running this test:
- From the test broker registration, go to Settings.
- Connect the internal system(s) you want to test using the API Reference.
- Add the applicable synthetic DROP data to the internal system you're testing. The synthetic records must exist in the system so they can be located and processed when DataGrail identifies a match.
- Confirm the internal system integration is connected and configured for your Data Broker Compliance workflow.
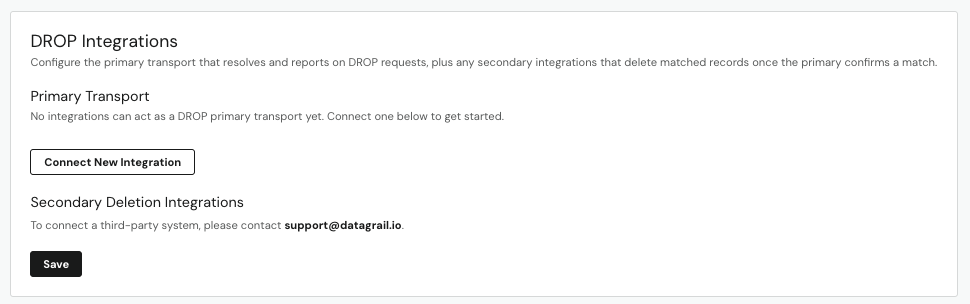
Once your integration is connected and you have test requests awaiting deletion dispatch (from running the test pipeline above), select Send Real Deletion Requests under Run Real Pipeline:
- Enter the number of Requests to Send. The oldest eligible requests are sent first — start with one to confirm your receiver responds as expected.
- Select Send Requests.
Unlike every other Test Mode action, Send Real Deletion Requests delivers real deletion requests to the endpoint configured for this broker. The receiving system may act on them as genuine deletions — use it only to validate your own receiver.
Send Real Deletion Requests is disabled until a webhook or ISI endpoint is configured as this broker's primary transport, and until at least one test request is awaiting deletion dispatch.
If a synthetic record does not exist in the connected internal system, the integration will not be able to locate the corresponding record during processing.
Review Your Test Results
After running the test pipeline, data will begin populating across the Data Broker Compliance module. From the test broker registration, use the following tabs to validate each stage of the process:
| Tab | What It Shows |
|---|---|
| DROP Tracker | High-level overview of matching progress and processing status |
| DROP Status | Results and status of your synthetic data pull from the DROP sandbox |
| DROP Records | Individual hashed records and their current status |
| Audit Logs | Record of actions performed throughout the DROP lifecycle |
Review these areas to confirm that data is being successfully retrieved, imported, matched, and processed as expected. If you're also testing internal system integrations, confirm that matched requests are successfully processing through the expected connected systems.
You can also view test requests directly in Data Subject Requests and Opt Out Requests.
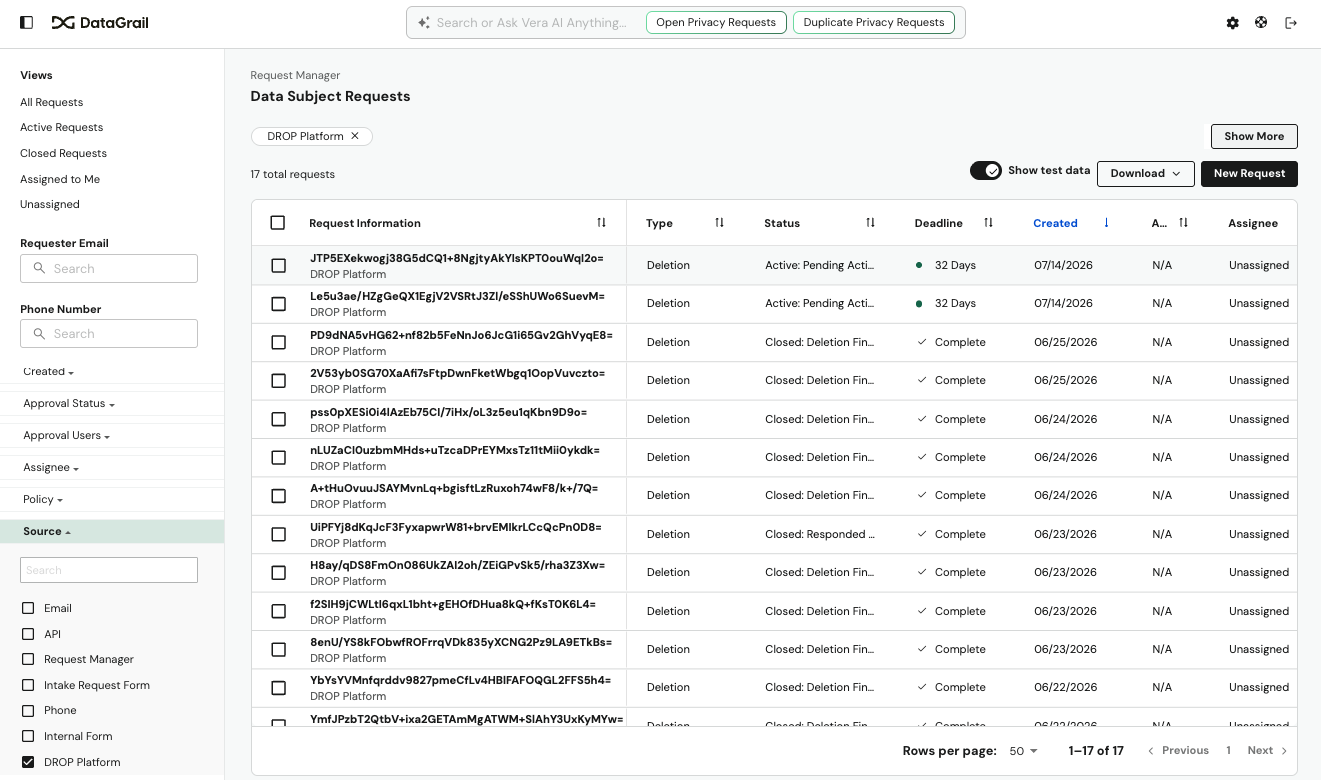
View test requests in Data Subject Requests
- Navigate to Data Subject Requests.
- Set the Source queue filter to DROP Platform.
- Toggle Show Test Data ON.
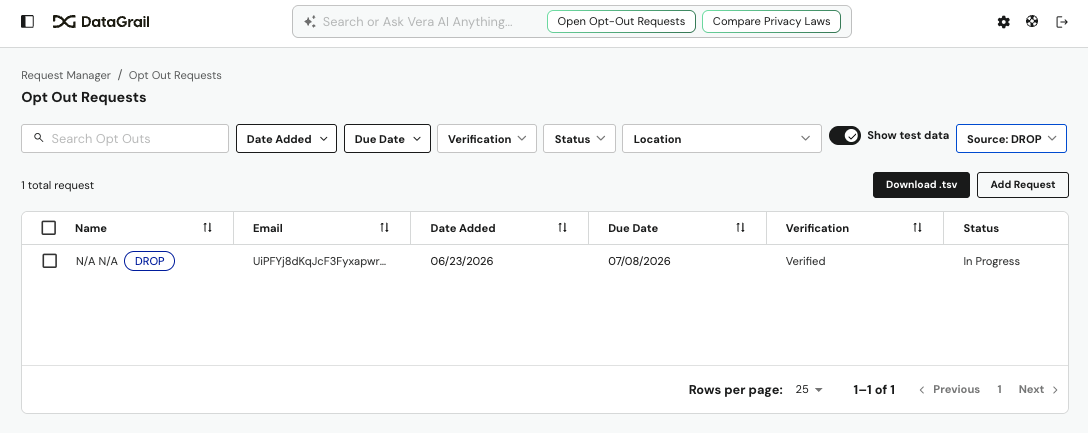
View test requests in Opt Out
- Navigate to Opt Out Requests.
- Set Source to DROP.
- Toggle Show Test Data ON.
If a synthetic record is later removed from the DROP registry's active list, DataGrail marks the corresponding DROP Records entry as Revoked. This reflects the consumer withdrawing their deletion request with CalPrivacy — it isn't an error in your configuration.
Once testing is complete and you've validated your configuration and processing behavior, you can proceed with your production Data Broker Compliance setup.
Common Issues
The following covers the most common issues encountered during testing:
Test identifier produces no match
Likely cause: Identifier not yet ingested, or ingested with a different format.
Resolution: Verify the identifier appears in Identifier Status and check for ingest errors.
Dispatch method not receiving the request
Likely cause: Webhook URL misconfigured.
Resolution: Verify configuration in the Quickstart.
Callback not received by DataGrail
Likely cause: Incorrect callback URL, auth token missing or expired.
Resolution: Check the callback_url value in your dispatch payload and verify your bearer token.
Audit log entry missing timestamps
Likely cause: Deletion outcome callback not yet posted.
Resolution: Confirm your system posted the outcome callback; check for errors in your dispatch logs.
Disclaimer: The information contained in this message does not constitute as legal advice. We would advise seeking professional counsel before acting on or interpreting any material.