Privacy Dashboard
The Dashboard supercharges legal and security teams' ability to assess, optimize, and report on the impact of their privacy program.This article will walk through how to use the Dashboard.
DataGrail User Roles
Only the following User Roles will have access to the Dashboard tab :
- Super Admin
- Live Data Map Admin
- Request Admin
- Risk Monitor Admin
NOTE : Combining any user roles that do not have access to this UI with any of the above user roles that do have access to this functionality will grant a user access to these updates. e.g. If a user had a Connections Manager Role, adding a Super Admin role to their user record in DGAdmin would then allow them access to the new Risk Monitor.
Dashboard Highlights
The Dashboard provides insight to Request volume, Direct Contact Integration processing time, Inventory System Report status', Money & Time Spent, and Tasks due, all filterable by date range and specific privacy policy (if you choose!).
The Dashboard will only be available to customers that have access to Request Manager and can be located by opening the DataGrail navigation bar on the lefthand side of the screen.
Workflow
Filters, System Reports, and Money & Time Metrics
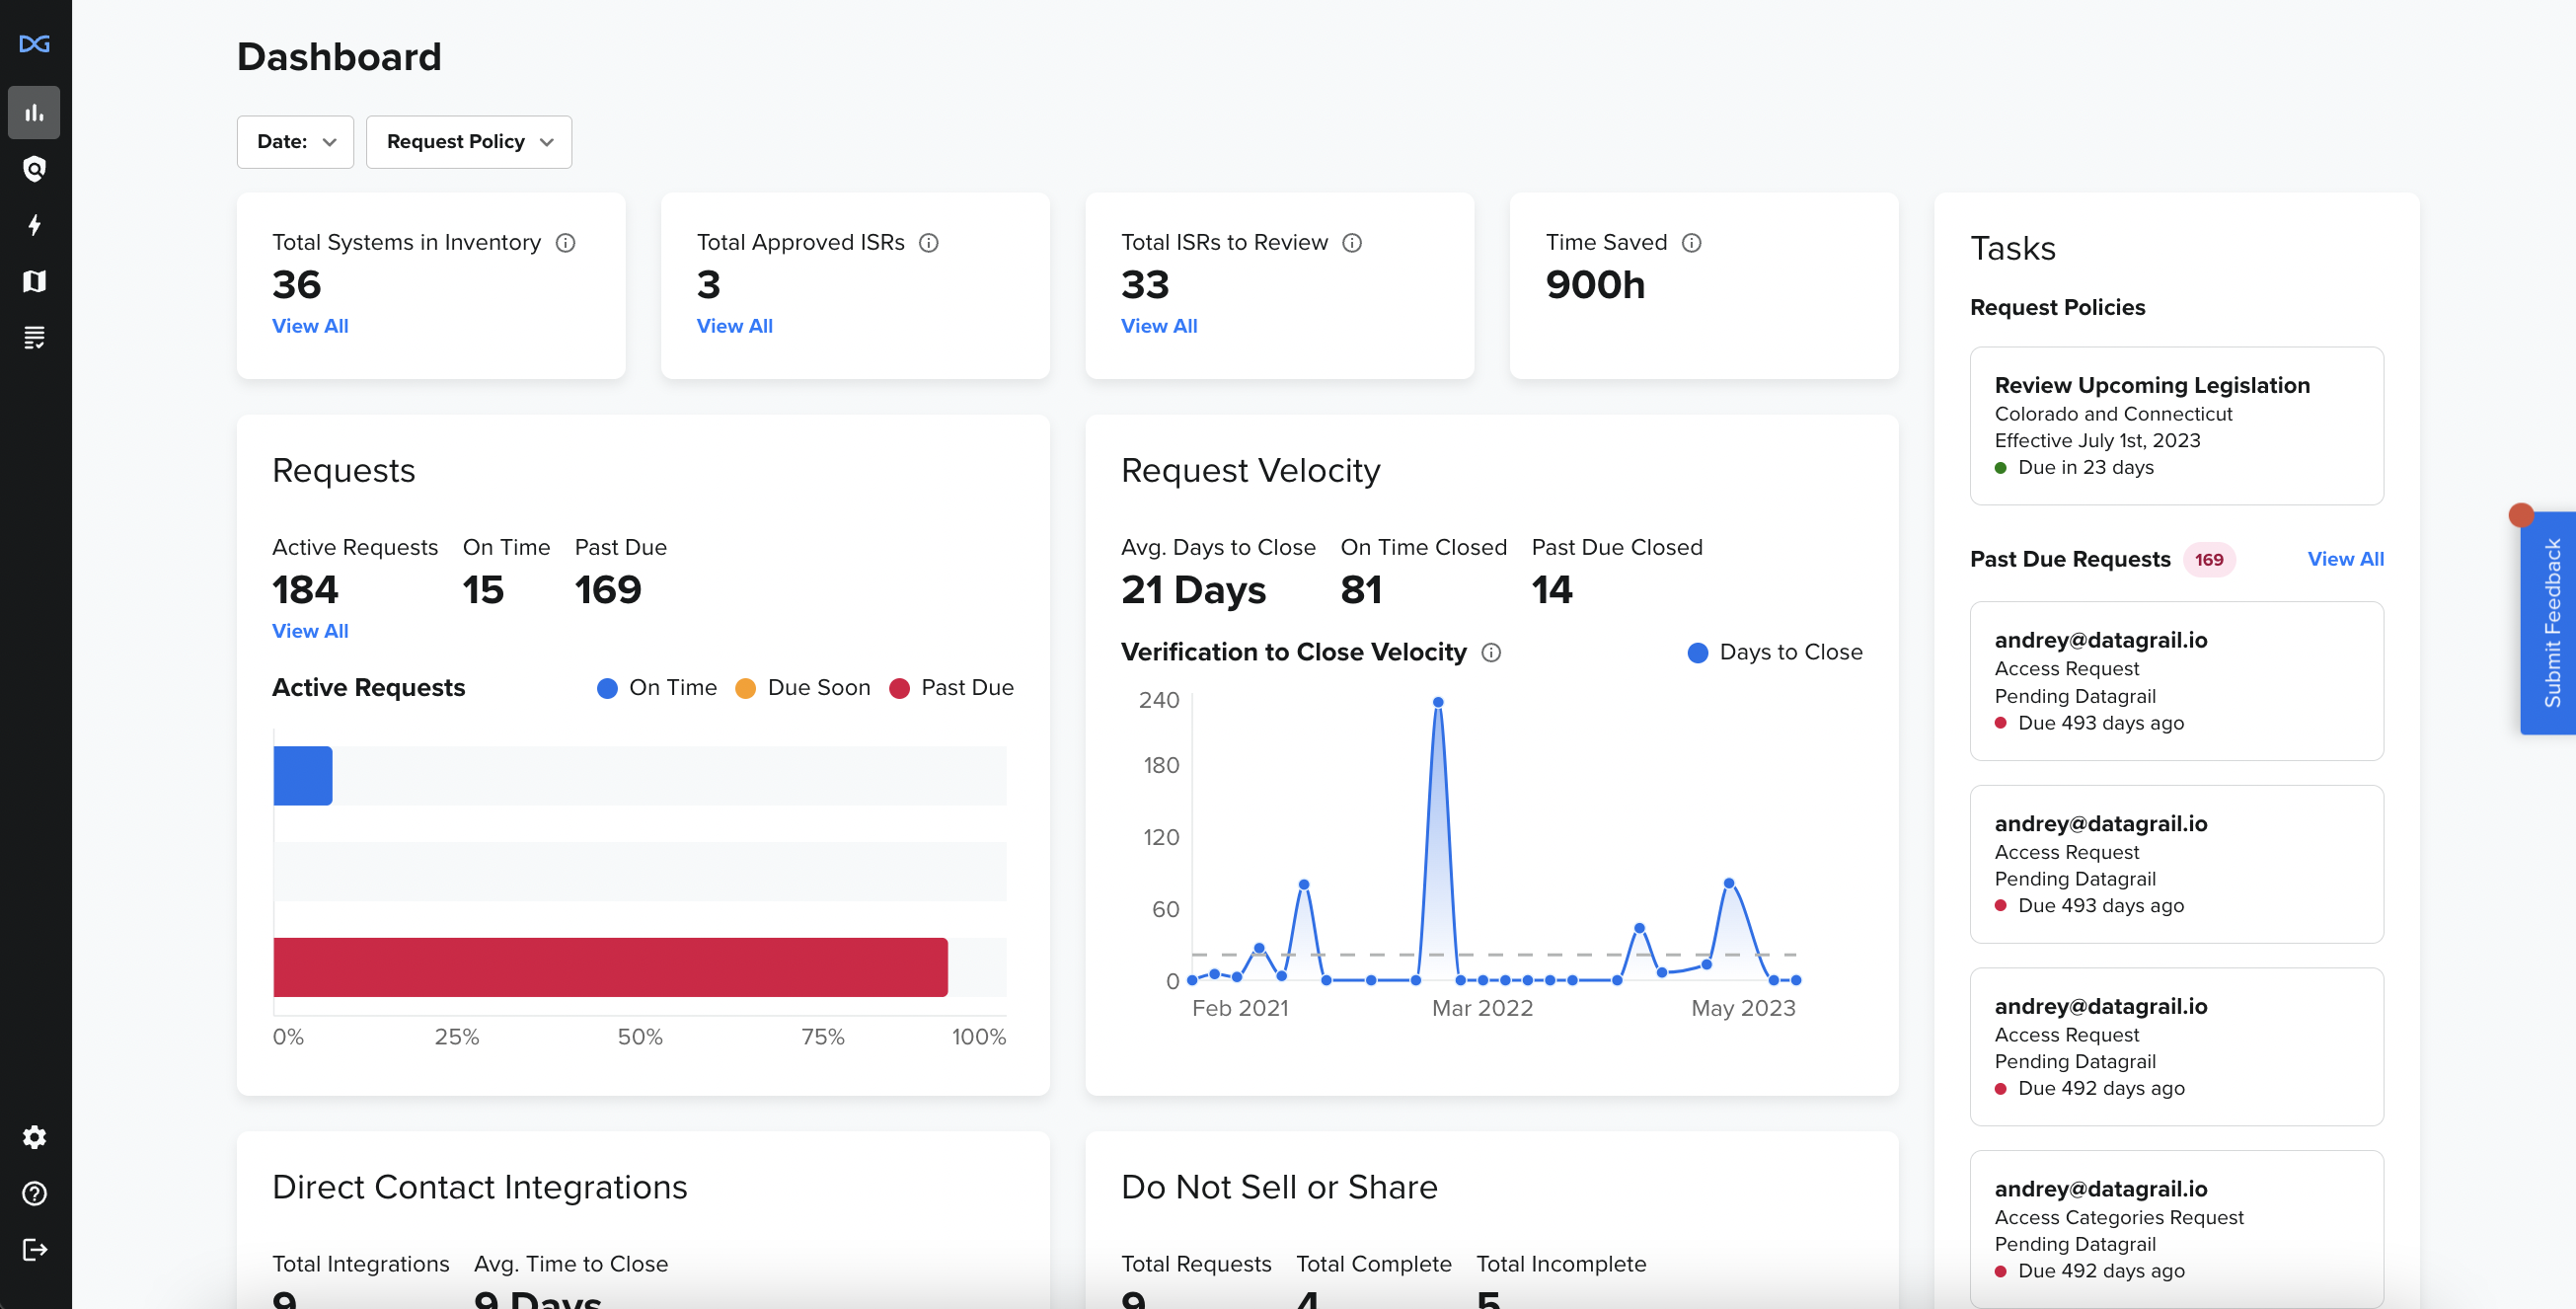
Filters are the first options provided to help you determine the data you'd like to view. The two filter types are below, with their associated options;
- Date Range (only one time frame can be selected at once)
- Last 30 Days
- Last 3 Months
- Last 12 Months
- All time
- Policy Type (multiple policies can be selected at once)
- GDPR
- CPRA
- US Standard Policy
- CCPA (Archive)
- Any additional policies that you may have set
You can select your choices by clicking on the arrow of each dropdown menu. The selections made will dictate the data you see on Dashboard
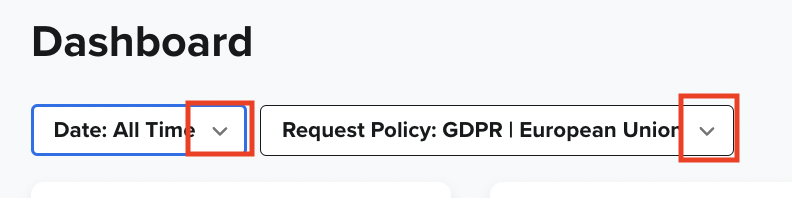
System Reports will give quick insight to total volume of reports, volume of approved, and volume of what still needs to be reviewed.
- Total Systems in Inventory
- This is the total number of systems that have been detected and/or added to your inventory
- Total Approved ISRs
- These are the number of Inventory System Reports that have been approved
- Total ISRs to Review
- These are all the Inventory System Reports that are ready to be reviewed for approval
(All definitions are available by hovering over the information icon)
By clicking "View All" in each category, you will be routed to a view point based on that filter, whether it is Total Systems (System Inventory page), Total Approved ISRs (filtered list of Approved systems), or Total ISRs to Review (filtered list of systems needing approval)
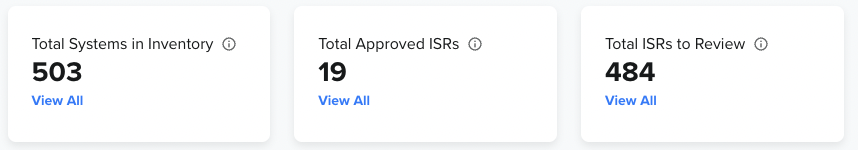
Time Saved will show the estimated time saved on processing Data Subject Requests over all time, regardless of filtered date range selected.
This calculation is based on the following
- Time spent to complete requests in DG
- Time to complete a DSR manually
(Definition/Calculation is available by hovering over the information icon)
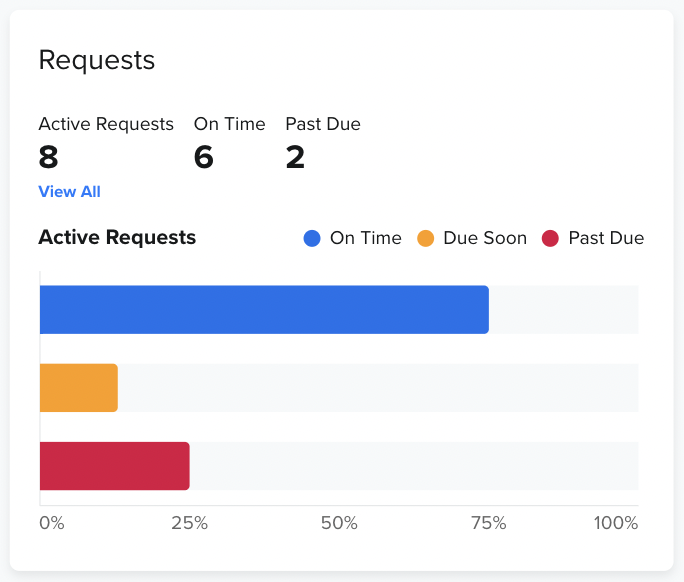
Requests and Request Velocity
Requests give a glimpse into your total volume of active requests, volume that are on time, and volume of those past due.
-
Active Requests
- All requests that are in an Active state
-
On Time
- Active requests based on where the difference between the current date and due date is more than 5 days
-
Past Due
- Active requests based on where the current date is later than the regulation due date
Request Velocity will provide a view of generally how long it takes to complete Active requests and give you a breakdown on Avg. Days to Close, On Time Closed, and Past Due Closed. You are also able to see when there may have been spikes in the time line for faster or slower completion rates by the Velocity chart.
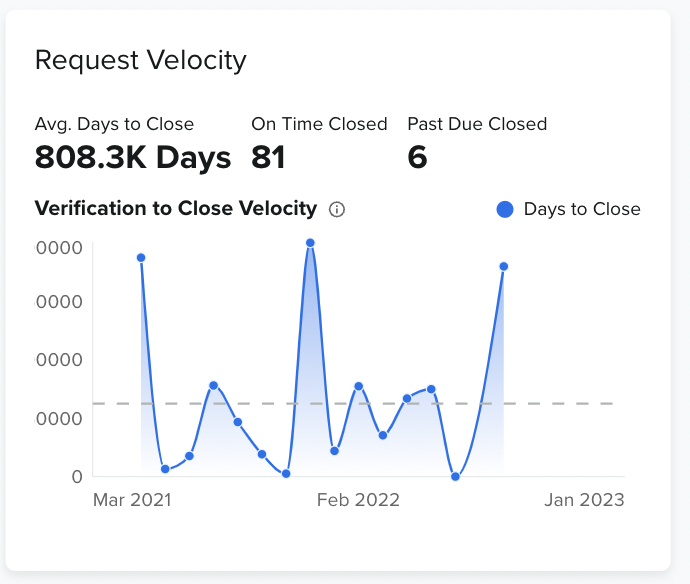
- Avg. Days to Close
- This is calculated by the date a request transitioned to Pending Wizard until request transitioned to a Closed state
- On Time Closed
- This is calculated as the request being complete within the policy SLA
- Past Due Closed
- This is calculated as the request being complete within the policy SLA
- Verification to Close Velocity
- This is the average number of days it takes to complete a Data Subject Request. The time begins when the requestor is verified and when the ticket is complete
These metrics do not include tickets that are marked as spam
Integrations and Do Not Sell or Share
Direct Contact Integrations will show the Total (Direct Contact) Integrations connected and the Avg. Time to Close. This can help you to partner with these vendors or internal processors on ways to improve the workflow and progress through completing requests at a more rapid pace.
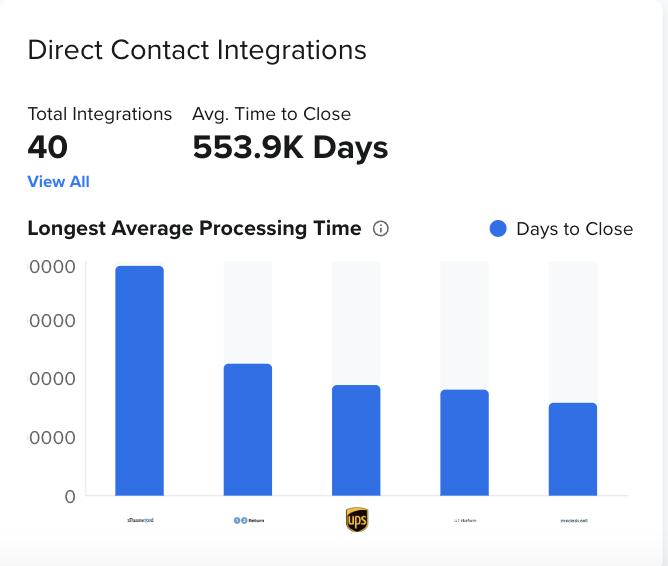
- Total Integrations
- This is the volume of (Direct Contact) Integrations that are connected (based on your Date Range Filter). By clicking "View All", you will be routed to your Integrations page and see a full view of all Integrations
- Avg. Time to Close
- This is calculated by the date a request transitioned to Pending Wizard until request transitioned to a Closed state (non-spam)
- Longest Average Processing Time
- Of all of your Direct Contact Integrations, these system owners or vendors take the longest time to fulfill your privacy requests
Do Not Sell or Share shows a breakdown of Total Requests, Total Complete, and Total Incomplete coming from submissions through your Do Not Sell form.
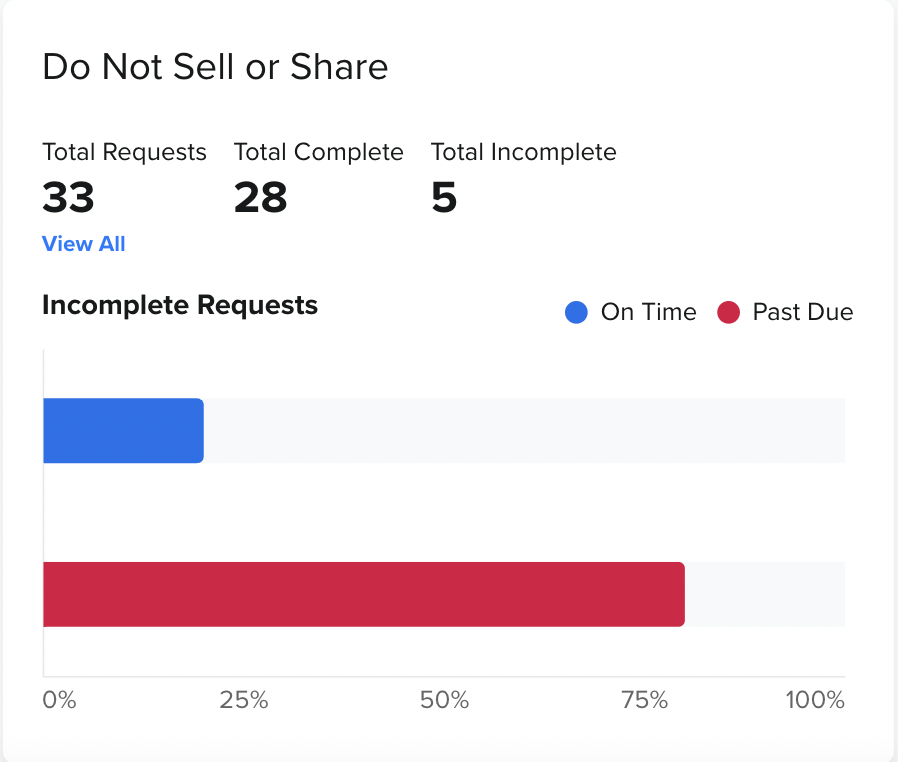
- Total Requests
- Total Do Not Sell/Share form submissions (based on Date Range selection)
- Total Complete
- Total Do Not Sell/Share form submissions that have been marked as "Complete" (based on Date Range selection)
- Total Incomplete
- Total Do Not Sell/Share form submissions that have not been marked as "Complete" (based on Date Range selection)
Tasks
Tasks are shown as your highest priority requests that need to be actioned. Whether they are Past Due or Current.
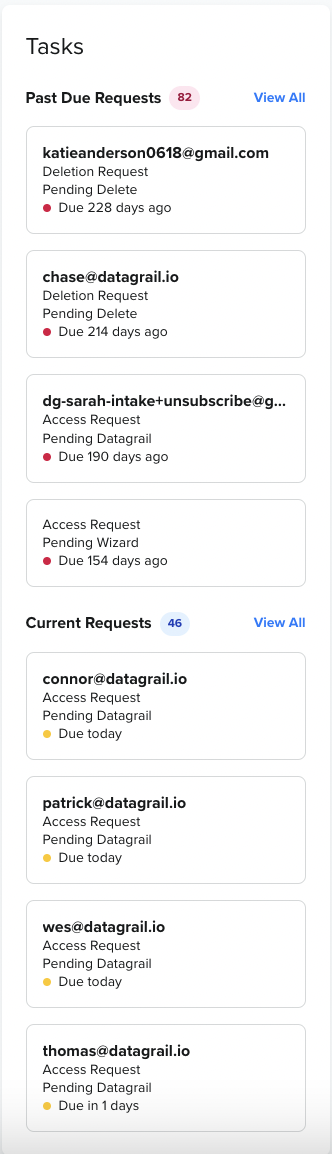
- Past Due Requests (total number of past due requests will be visible)
- Active requests that are past their policy determined SLA. Top request will be the most past due date.
- Current Requests (total number of current requests will be visible)
- Active requests that are due on the day you are viewing the dashboard. Top request will be the closest to being past due date.
By clicking "View All" in each category, you will be routed to a view point based on that filter in your Request Manager, whether Past Due or Current Requests.
If you have any questions about this feature, please reach out to your dedicated CSM or support@datagrail.io.
The information contained in this message does not constitute as legal advice. We would advise seeking professional counsel before acting on or interpreting any material.